I stared into the abyss of this business challenge. The old method consisted of 200+ odd ball queries in an Access database. No documentation. You know how it happened. Years ago some hack fixed a small problem with a few queries when the business challenge was small. The business grew in size and complexity, more hacks by other hackers and now: 200+ odd ball queries limp along doing a barely adequate job of what is now a potentially costly business process. By the way the old process took about 5 man days and was fraught with error. Auditors nightmare & a beast to support. There had to be a better way.
My gut feel was that Power Query had potential to “help” but I can honestly say I had no clear vision of the solution when I dove in. ***Spoiler alert*** Power Query not only helped, it turned out to be THE solution. Such a slick solution I felt motivated to blog about it. I’ll dumb down the actual story, but to appreciate the “power” in Power Query one must appreciate the challenge.
Think of a large distributor of hard goods that had negotiated special rebate terms with its best customers. CustomerA gets 8% rebate on hand tools purchased in the Midwest, CustomerB gets 7% rebate on all products purchased in the West, CustomerB also gets 6% rebate on Plumbing parts purchased in the Southeast which were manufactured by CompanyZ… and the list goes on. All these unique terms are captured & updated monthly by the Contracts department in a single spreadsheet. Of course this is a sacred spreadsheet that can only be viewed – thus these terms must be extracted “as is”. Here is a dumbed down sample of the controlling table “RebateMaster” found in the spreadsheet:
The more I looked at this table the darker the abyss became. How to apply these rebate rules to the Sales data to derive the records that meet this crazy criteria? I’ll skip the details of the dead ends explored. The ray of hope started to shine when I thought of this as more of a “layered filtering” or “funnel” challenge. Looking at the columns from left to right, each column further filters the overall sales dataset by some criteria. If for every row in this table I could start with all the sales data and filter by [Customer], then filter that result by [Sales Region], then filter that result by [Product Group], then [Product List], then [Manufacturer]… the result would be all the sales records that meet the criteria for that rebate record. Eureka!!! That’s the data we seek!!!
How can Power Query do this “funnel”? With a paradigm shift – well it was a paradigm shift for me. My experience with Power Query to date was limited to traditional data cleansing and shaping at the detail record level. This challenge was far from traditional. My paradigm shift: Stay at the rebate table level and process whole tables worth of Sales data with M code. This is really much easier than it sounds.
Following best practices recommended by Ken Puls I knew to create a connection only queries to my data sources. For brevity… trust me that I created
- srcRebateMaster_tblCustomers – table of customers that get rebates
- srcRebateMaster_tblMfg – table of manufacturers that participate in the rebates
- srcSales – table of Sales data pulled from SQL server. Since this query uses some Ken Puls’ trickery (but a bit off topic) I include it below
Time to bring in the Rebate table shown above. No tricks here, just pull it in like any ole Excel table. Now the paradigm shift. Add a custom column [SalesThisCustMfg] that filters srcSales by [Customer] & [Manufacturer]. Then add a custom column [SalesThisRegion] that filters [SalesThisCustMfg] by [Sales Region]. Likewise for [SalesThisProductGrp]:
Later I will show the M code for these Added Columns. First a little refresher on the Power Query interface. If I were to click on “Table” circled in red I would see the sales records for CustomerA. If instead I were to click on the funky arrows circled in blue I would see the sales records for all the customers in the table. Now that is powerful!!! Love this feature!!! This is very handy place to prove out the formulas and troubleshoot issues ongoing. Thus I will not add any more steps to this query, but rather save it as is (connection only) so I can reference it for the final processing steps in another query and also have it readily available for debugging down the road.
To continue, from the list of queries, right click on the query tblRebateMaster and select “Reference”. This creates a new query where the source is defined as tblRebateMaster and we are right where we left off. Good news is most of the work is done. The quick finish is to remove all but [Rebate%] and [SalesThisProdList] (remember it was the last filter applied in our funnel), then click those funky arrows on [SalesThisProdList] to get the result set of Sales records we were after. Add another Column which multiplies [Rebate%] by [Sales Amount] and you have now calculated the [Rebate Amount]. Close and load this to your data model and pivot away on your newly defined Rebate data.
Bask in the glory of replacing 200+ SQL queries!!! Now those folks in Contracts can add/remove customers as needed. Yes, I might need to update some of the “funnel filters” if a rouge salesman negotiates a completely new rebate term – but with Power Query I’m not scared…
Oh yeah, there is that matter of the M code that does the “funnel filters”. Here tis:
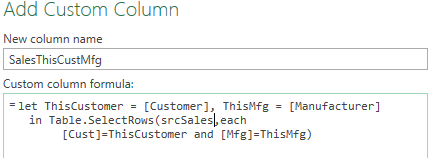
[SalesThisCustMfg] – needs to filter srcSales by [Customer] and [Manufacturer]. Assumes srcSales fields of [Cust] and [Mfg]. Note – There is a limitation that the field [Customer] cannot be referenced inside Table.SelectRows(). Solution is to first assign the value of [Customer] to the variable ThisCustomer, which CAN BE referenced inside the function. Same for [Manufacturer].
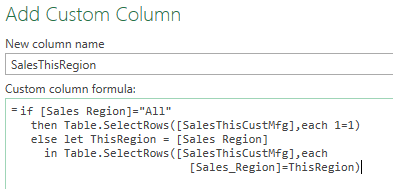
[SalesThisRegion] – needs to filter [SalesThisCustMfg] by [Sales Region]. Assumes srcSales field of [Sales_Region]
[SalesThisProdGrp] – needs to filter [SalesThisRegion] by [Product Group]. Assumes srcSales field of [Prod_Grp]
srcSales: Instead of just pointing the query at the whole Sales table, for performance I pulled only the Sales records for the Customers and Manufacturers that participate in the rebate program. Here is the M code (paraphrased):
srcSales:
FiscalStart = fnGetParameter(“FiscalStart”),
FiscalEnd = fnGetParameter(“FiscalEnd”),
CustList = Table.Column(srcRebateMaster_tblCustomers,”Customer Number”),
CustListSQL = “‘” & List.Accumulate(CustList, “”, (state, current) => if state = “” then current else state & “‘,'” & current) & “‘”,
MfgList = Table.Column(srcRebateMaster_tblMfg,”Manufacturer”),
MfgListSQL = “‘” & List.Accumulate(MfgList, “”, (state, current) => if state = “” then current else state & “‘,'” & current) & “‘”,
SQL=”Select * from Sales
where Customer in (” & CustListSQL & “)
and Manufacturer in (” & MfgListSQL & “)
and Fiscal_Period between ” & FiscalStart & ” and ” & FiscalEnd,
Source = Sql.Database(“server1.myco.com”, “Sales”, [Query=SQL]),
srcSales Notes:
-
FiscalStart/FiscalEnd are pulled from a parameter table like Ken blogged
-
CustList/MfgList are tables in the Excel file referenced by srcRebateMaster
-
CustListSQL/MfgListSQL – same data as above, but reformatted from a table to a delimited string compatible with SQL
-
SQL – string of executable SQL built using above parms, which is then used in Sql.Database()
As a final note I will add that I was concerned about performance during development. In my real rebate dataset I have roughly 10 “funnel filters”, hundreds of customers that get rebates, and 10 million Sales records of which 10% get some kind of rebate. I toyed a bit with Table.Buffer() and I pondered query folding… Truth is performance never was a problem. My data model loads in less than 5 minutes which serves the need well.
I hope you find this info useful. Perhaps next time you find yourself staring into the abyss, Power Query will be your ray of hope…