I was recently faced with a challenge:
CxO: Your PowerPivot dashboard is awesome! But… it is too big to email to the Regions… and they don’t need to see each other’s data…
Me: Sir we have many ways to securely disseminate this data to the field. The Microsoft BI stack… On premises… Cloud… SharePoint… licensing… $$$…
CxO: <eyes glazed over> just send them an email attachment…. only their data… preferably today… then monthly…
Yes, old school email reporting is alive and well in Corporate America. Much as I love all the new possibilities (thinking animated bubble chart of near time data on an iPad… screencasted to a 4G display… I digress…), when the field needs a table of data we still need to get them that table – as they want it, typically email. Many platforms do this and do it well (thinking SSRS), but if you just built a management dashboard in PowerPivot and you want the field’s data to match, it’s best to produce the field’s data as a derivative of the dashboard. I’ll pause here for questions…. Good… glad we agree.
So that’s the “why”. Fortunately the “how” is pretty easy. I hope to make your experience even easier by sharing my methods here. I don’t pretend any of this is new or cutting edge, but as I had to seek out many answers from many places… I’m hoping this collection will be of value.
General Approach:
- Crunch the data in PowerPivot: Premise here is that a PowerPivot dashboard has already been built. Many have blogged about this. Great examples abound. PowerPivot rocks!!!
- Expose the PowerPivot data as a table in Excel: It’s a simple DAX query, but as it is a bit of an unusual approach the steps are detailed below.
- Pivot on that table into another spreadsheet: Old school Excel Pivot method that should not be forgotten. Details revisited below.
- Distribute: email. ‘nuf said.
Expose the PowerPivot data as a table Excel:
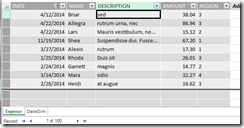
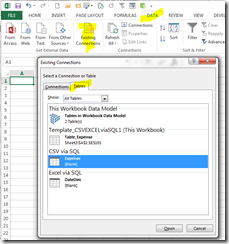
Most of the time in the PowerPivot world we create PowerPivot tables and PowerPivot charts to see the data in Excel. Works great most of the time. However PowerPivot tables do not behave like regular tables. In this case it is a real bummer that a PowerPivot table can’t be the data source for a regular Pivot Table. Fortunately, we can expose the PowerPivot data via a DAX query that results in an Excel table that behaves like a regular Excel table. To illustrate, consider a simple PowerPivot data model of an Expense table and a Date table. From a clean sheet in Excel select Data/ExistingConnections/Tables and select the Expense table then Open. You should now have an exact copy of PowerPivot’s Expense table as a table in Excel, in this case named Table_Expense. The good news is this table can be used as a data source for a traditional Excel Pivot Table. Yeah!
PowerPivot Data Model:
Bring PowerPivot Table into Excel:
Expense Table in Excel:
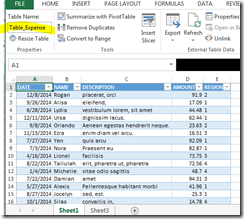
True to our premise though, we need to limit this data by Region so each Region gets only their data. Right click on the table and select Table/EditDax. You have now entered the brave new world of DAX where possibilities are limited only by your imagination and skill. Careers can be made by those who dive deep into DAX… powerful stuff… Truthfully, my DAX skillset is limited to just pulling desired fields with perhaps a simple filter or two – which is all we need for this project. For this illustration I created the following DAX query:
DAX Query example:
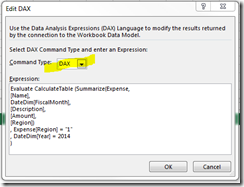
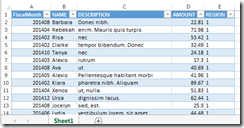
For me DAX syntax is a bit odd, but manageable. In laymen’s terms we Summarize the Expense table, pulling the fields listed and filtering by Region=1 and Year=2014. Note that you can pull a field from related tables such as DateDim[FiscalMonth]. Also note that filters must be fully specified with the table name such as Expense[Region]=”1″. That my friends is probably enough DAX knowledge to satisfy most of your DAX needs. You are welcome. With the curtain falling on Act I, here is the filtered Expense table in Excel:
Expense Table Filtered for Region 1:
Pivot on that table into another spreadsheet
Bravo!!! Act I was marvelous. We begin Act II with a beautiful table of data that we can treat like a traditional Excel table. We can Pivot on Table_Expenses into a spreadsheet in another workbook. Open a clean new workbook and select Insert/PivotTable. Define the data source as in my example C:\temp\ExpensePP.xlsx!Table_Expense.
Create a traditional Pivot Table:
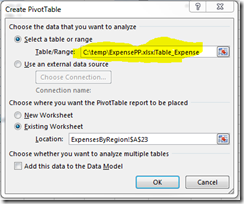
Here is a simple pivot showing summarized data for Region=1:
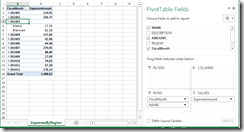
Note that the ExpenseByRegion workbook shown is a simple old school Excel workbook with an old school Pivot Table with the pivot’s data loaded in the Pivot Cache. To see the contents of the Pivot Cache, drill on the Grand Total. You will see the detail records for Region 1 and only Region 1. This is a very efficient report to email as it contains one copy of the detail Expense records for Region, yet the report consumers can drill to the detail as needed. In my real world job I have a PowerPivot Dashboard that is over 80MB, yet it spawns 5MB derivative reports for each Region that can easily be emailed. After the Region 1 report is created, I modify the DAX for Regions 2-4, refreshing the ExpensesByRegion workbook each time to create region specific workbooks.
With this approach I satisfied the immediate need & survived another day. But what about the next month??? Must I redo all this??? What about that big ugly sheet I created in my beautiful Dashboard workbook… Are my Dashboard users stuck with that too??? Well, for my grand final & encore:
As a final step I “hack the DAX” to prevent the table from populating so it won’t unnecessarily bloat my Dashboard, and then hide the sheet so as to not confuse my Dashboard users. What is that DAX hack? For me & mine I insert a bogus filter that results in an empty table. I could just delete the sheet (including Table_Expense) & recreate it next month, but this way the DAX query (which I don’t want to recreate, or go find elsewhere) stays intact, easy to modify.
DAX which forces an empty table:
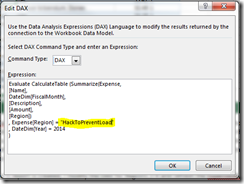
So next month I refresh the Dashboard, unhide the Sheet with Table_Expense & modify the DAX for each Region, refresh the ExpenseByRegion workbooks. Rinse… Repeat…
Editing the DAX too manual you say??? I agree, and hope to find a method to programmatically control the DAX someday… But back to the real world – those Regional folks are a bit picky and demand their own unique reports. This manual step of editing the DAX is where some of that uniqueness is addressed. Automation good. Agility sometimes better.
Hope this helps. I also hope to hear suggestions from others. Till then… Pivot Onward… PowerPivot Onward… and when necessary do both!!!